Article
May 5, 2026
RTOSTwin
RTOS Digital Twin and Observability Bridge

RTOS Digital Twin and Observability Bridge
RTOSTwin is an end-to-end embedded observability system that turns low-level FreeRTOS runtime state inside a microcontroller into a live digital twin visible through the same open observability stack used for cloud and backend systems: Prometheus, Grafana, and OpenTelemetry.
At a practical level, this project proves that a small STM32 microcontroller can continuously expose task scheduling state, CPU usage, heap health, stack headroom, packet-loss behavior, and memory-risk trends to a standard metrics pipeline without requiring a proprietary backend, a paid fleet-monitoring service, or a permanently attached debug probe.
This project was built and validated on a real NUCLEO-F401RE board running FreeRTOS, with a Python bridge on the host side and a full Prometheus -> Grafana observability path. It was later refactored into a reusable embeddable module so the telemetry agent can be dropped into another STM32 firmware project as a clean library/API rather than remaining a one-off demo.
Technology Stack
Embedded:
C99,FreeRTOS,STM32 HAL,UART DMA,DWT cycle counterHost bridge:
Python,pyserial,pytestObservability:
Prometheus,Grafana,OpenTelemetry OTLPPlatform baseline:
NUCLEO-F401REArchitecture style: embedded telemetry agent + host-side protocol bridge + live metrics dashboard
The Problem This Project Solves
Modern backend and distributed systems are easy to monitor. Teams already know how to inspect CPU, memory, queue depth, latency, and error rates using standardized observability pipelines. An engineer can deploy a service, point Prometheus at it, wire it into Grafana, and immediately understand whether the system is healthy.
Embedded RTOS systems do not usually get that treatment.
A FreeRTOS application may have many tasks, dynamic scheduling behavior, stack watermark risk, heap pressure, and fault patterns that matter deeply in production, but once that firmware is deployed, most teams lose visibility into the operating system itself. During development they may use debug probes, IDE views, tracing tools, or proprietary commercial platforms, but those approaches do not translate cleanly into an open, self-hosted, standards-based monitoring path for deployed devices.
That gap is exactly what RTOSTwin targets.
The thesis behind the project is simple:
A real RTOS device should be observable with the same open metrics stack used for servers.
That idea drove everything in the system:
a lightweight MCU-side telemetry agent
a compact wire protocol with framing, CRC, keyframes, and deltas
a host-side bridge that reconstructs full device state
Prometheus metrics and OTLP export
a Grafana dashboard that acts as a live digital twin for the board
What RTOSTwin Actually Does
RTOSTwin continuously captures RTOS-internal health signals from a running microcontroller, serializes them into a compact binary protocol, transports them over UART, reconstructs the state on the host, and publishes that state as standard observability metrics.
The system tracks:
task state
per-task CPU distribution
total CPU utilization
heap free bytes
minimum-ever heap
stack watermark per task
telemetry packet loss
projected out-of-memory risk
This means the microcontroller is no longer a black box. It becomes an observable runtime system with a live operational model.
Core Architecture
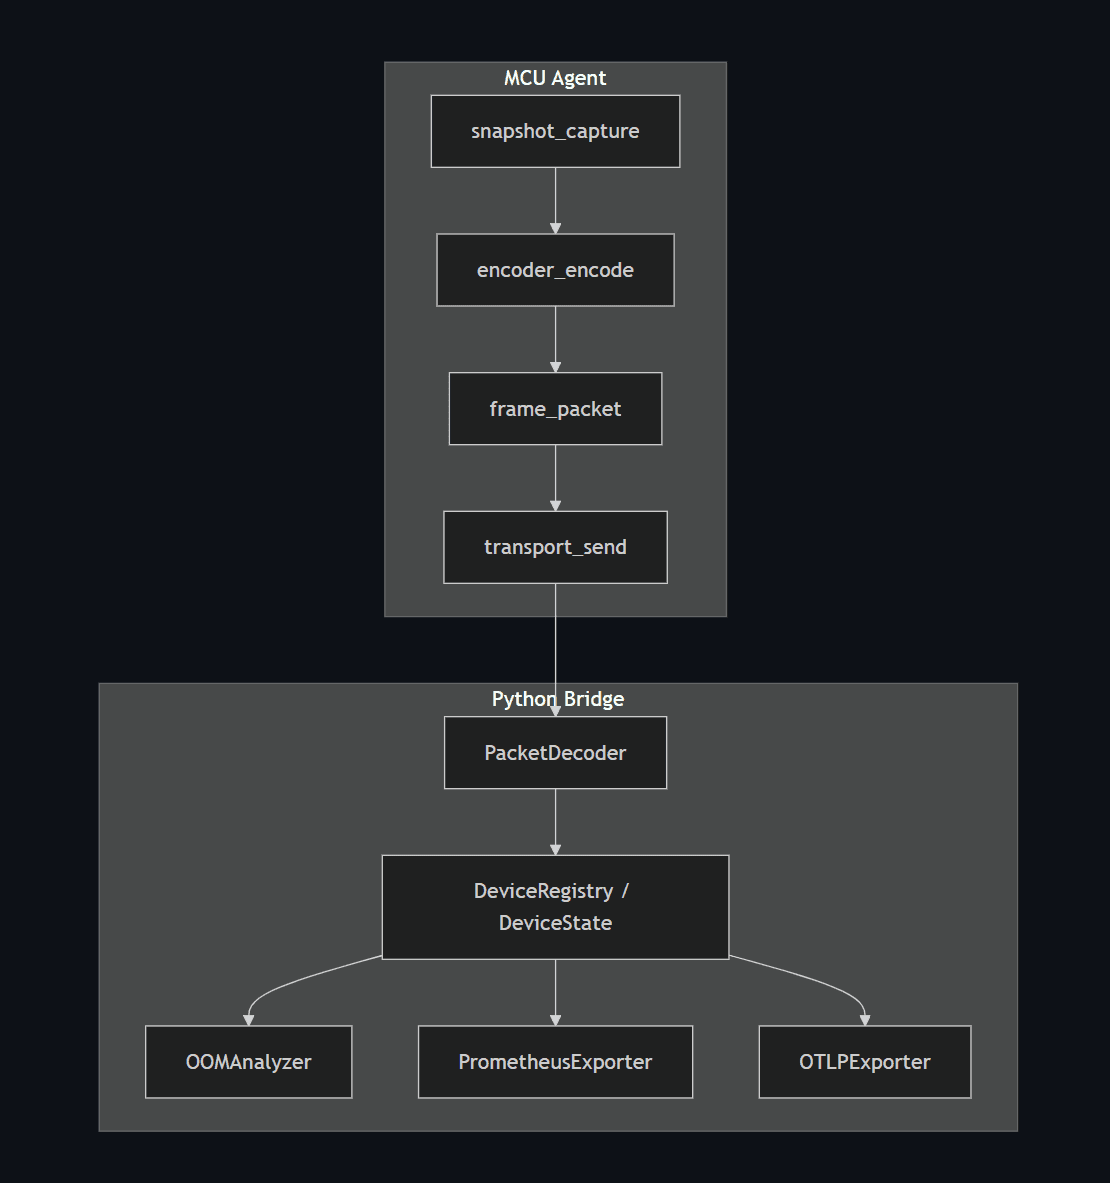
The architecture has three major layers:
1. MCU Telemetry Agent
Runs inside the embedded firmware alongside the application. Its job is to collect RTOS state with minimal overhead and package it into a stable binary telemetry stream.
2. Host-Side Bridge
Runs on a PC or edge machine. It receives the raw serial packets, validates and decodes them, reconstructs full device state from keyframes and deltas, and turns that state into metrics.
3. Observability Layer
Prometheus scrapes the bridge, Grafana visualizes the metrics, and OTLP enables export into broader observability systems.
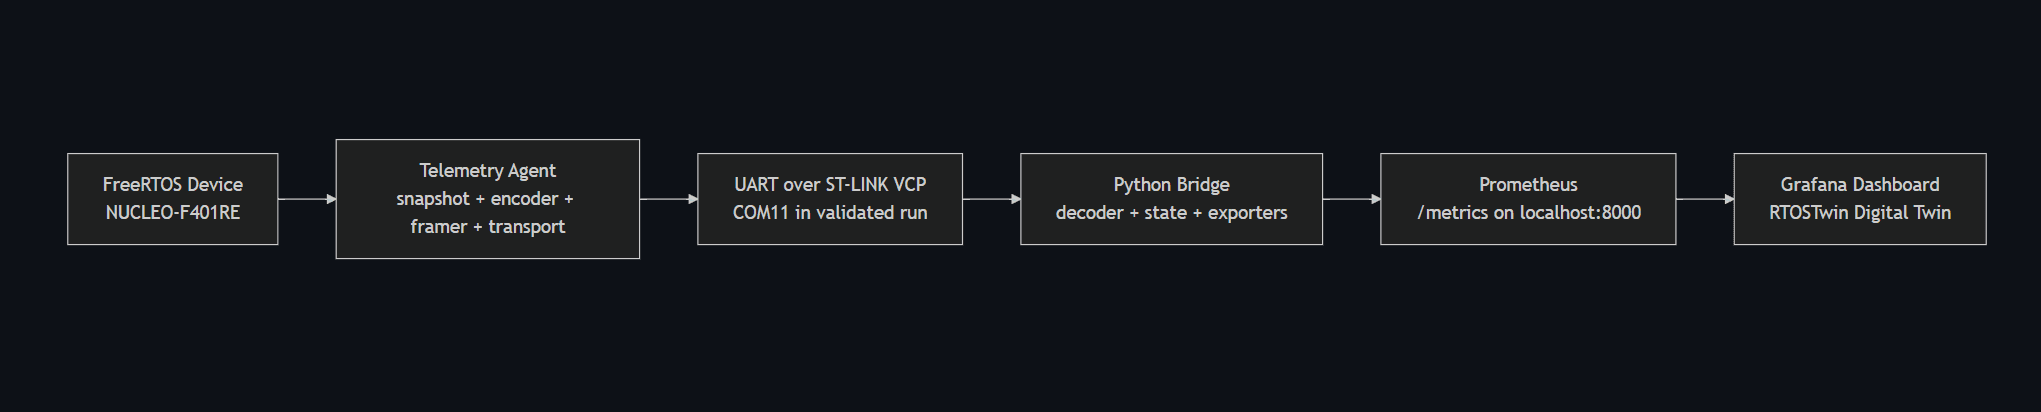
High-Level Data Flow
Embedded Agent Design
The embedded side was designed around one hard constraint: visibility is only useful if it is cheap enough to leave on.
That meant the telemetry agent had to:
avoid dynamic allocation in the hot path
use fixed/static buffers
keep CPU cost well below the loop budget
preserve a stable, testable wire format
work on a real constrained STM32 target
Main Agent Responsibilities
The agent performs the following loop:
Capture a snapshot of the RTOS state.
Encode the snapshot as either a full keyframe or a delta relative to the previous snapshot.
Frame the payload with synchronization bytes, metadata, sequence number, timestamp, and CRC.
Send the packet through a UART DMA transport.
Repeat periodically.
Why Keyframes and Deltas
A naive design would send the full task and memory state on every cycle. That would waste serial bandwidth and increase CPU cost. RTOSTwin instead uses:
keyframes for full state refresh
delta packets for only what changed
This drastically reduces steady-state bandwidth while preserving correctness and recovery.
Snapshot Layer
The snapshot engine captures:
task list
task state
task priority
task stack watermark
per-task runtime counter
heap free bytes
minimum-ever heap
CPU utilization
This is the point where the project reaches into the RTOS internals and converts them into a structured runtime model.
Encoder Layer
The encoder decides whether a packet should be:
a full keyframe
a compact delta
It also forces a keyframe when topology changes happen, such as task-count changes or task identity changes, so the host never drifts away from the true system state.
Framing Layer
The framing layer adds:
synchronization bytes
protocol version
packet type
sequence number
timestamp
payload length
CRC-16-CCITT
This makes the UART stream robust enough to decode continuously on the host without silently accepting corrupt data.
Transport Layer
The validated transport path is STM32 UART DMA. This gives the agent a low-overhead non-blocking output path suitable for periodic telemetry.
Host Bridge Design
The host bridge is where raw embedded telemetry becomes operational observability.
Why a Bridge Exists
The MCU should not try to run Prometheus or OpenTelemetry directly. That would be too heavy, too coupled, and inappropriate for a small microcontroller. Instead, the MCU sends a compact binary stream, and the bridge translates that into standard observability formats on a machine that can afford the software stack.
Bridge Responsibilities
The bridge:
opens the serial port
consumes the byte stream
reassembles valid framed packets
verifies CRC and packet structure
reconstructs full device state from keyframes and deltas
tracks devices by
device_idexposes current state as Prometheus metrics
optionally exports the same state through OTLP
runs OOM trend analysis on heap behavior
State Reconstruction
The bridge does not treat every packet as a standalone record. It maintains a live model of the device and updates that model incrementally as packets arrive.
That means the host always knows the current state of:
task set
task CPU distribution
task stack headroom
heap status
health indicators like packet loss and memory-risk projection
Bridge State Model
This separation matters because it gives the system clear boundaries:
decoder handles protocol correctness
state manager handles semantic reconstruction
device registry handles multi-device state ownership
exporters handle observability output
analyzer handles higher-level diagnosis
OOM Analyzer
One of the strongest ideas in the project is that it does not stop at passive monitoring. It performs interpretation.
The bridge includes an OOMAnalyzer that studies heap behavior over time and estimates memory-risk trends. The point is not just to show a heap number, but to answer a more operational question:
Is this device slowly dying from a leak, or is it stable?
The analyzer was validated against:
stable mock workloads
controlled leaking mock workloads
saturated but non-leaking workloads
OTLP export scenarios
the real STM32 hardware lane
This turns the project from a pure telemetry pipe into a runtime health-analysis tool.
Why the Project Is Technically Interesting
RTOSTwin is not just a dashboard wrapper around an embedded demo. The engineering value comes from the fact that it had to solve several hard problems simultaneously:
how to observe RTOS state inside a small MCU
how to keep the telemetry overhead low enough to be practical
how to serialize that state into a compact stable protocol
how to recover and maintain correctness across keyframes and deltas
how to bridge embedded runtime data into open observability standards
how to validate the whole thing on a real board rather than staying in a simulated lane
The project also had to be honest about evidence. It was not enough to say “the architecture makes sense.” The pipeline had to be measured and proven.
Validation Strategy
The project was intentionally validated in layers:
This staged approach matters because it reduced risk:
protocol work came first
decoder correctness came before hardware dependence
host observability came before real-board proof
real hardware proof came before performance closure claims
packaging into an embeddable API came after the validated baseline was stable
Real Hardware Baseline
The primary validated hardware lane is:
Board:
NUCLEO-F401REFirmware project:
RTOSTwinF401RE_cleanSerial path:
STMicroelectronics STLink Virtual COM Port (COM11)Bridge command:
python bridge/main.py --port COM11 --baud 115200 --device-id nucleo-f401re
This is important because it proves the project is not only a local mock or simulation pipeline. It was actually built, flashed, run, ingested, and visualized on real hardware.
The Exact Hardware-to-Dashboard Pipeline That Was Proven
The validated milestone was:
NUCLEO-F401RE -> FreeRTOS telemetry firmware -> ST-LINK virtual COM port -> Python bridge -> Prometheus -> Grafana
That end-to-end path is the central proof point of the project.
Metrics the System Exposes
The live metrics include:
rtos_cpu_utilization_ratiortos_task_cpu_ratiortos_heap_free_bytesrtos_heap_min_ever_bytesrtos_task_stack_watermark_bytesrtos_task_statertos_telemetry_packet_loss_ratiortos_heap_oom_projection_seconds
These metrics are meaningful because they cover both:
immediate runtime state
operational risk indicators
For example:
CPU tells you whether the scheduler still has headroom
stack watermark tells you whether a task is approaching overflow
heap metrics reveal pressure and fragmentation behavior
OOM projection tells you whether the memory pattern looks stable or leak-like
packet loss tells you whether the telemetry path itself can be trusted
Measured Results
This is where the project moves from “interesting architecture” to “credible engineering system.”
1. Cadence
The validated telemetry cadence on STM32 was:
Measured cadence:
9.52 HzTarget cadence:
10 HzMeasurement window:
63 secondsPacket-count delta:
600 packetsPacket integrity during measurement:
drops=0,seq_gaps=0
This matters because it shows the periodic telemetry loop ran at the intended operational rate without losing integrity.
2. CPU Overhead
The validated telemetry-cycle overhead on STM32 was:
Telemetry-cycle mean cycles:
72987Mean telemetry-cycle time:
868.9 usCPU overhead at 10 Hz:
0.869%
The project’s acceptance target was below 2%, so this result passed with strong headroom.
This is one of the most important numbers in the system because embedded observability only becomes viable if it is cheap enough to keep on continuously.
3. Snapshot Cost
Measured snapshot-capture statistics:
Snapshot min cycles:
58644Snapshot max cycles:
70770Snapshot mean cycles:
58998
This shows that even the actual state-capture portion remained within a controlled budget on the validated hardware baseline.
4. Static RAM Footprint
Measured agent-specific static RAM:
Agent
.databytes:0Agent
.bssbytes:2543Agent static RAM total:
2543 bytes
The project target was below 10 KB, so the validated baseline passed that requirement comfortably.
5. Dynamic Allocation Audit
The telemetry hot path passed the no-allocation audit:
no
mallocno
callocno
reallocno
freeno
pvPortMallocno
pvPortFree
That matters because dynamic allocation in the hot path would have made the timing and memory behavior far less trustworthy.
6. Real Hardware Build Evidence
The successful firmware build produced:
This confirmed that the real telemetry firmware was built and linked into the embedded image rather than staying in a partial or placeholder state.
Real Hardware Runtime Evidence
The bridge opened the board successfully at:
COM11 @ 115200
Representative bridge logs from the validated run:
The packet count continued upward into the thousands with no observed gaps or drops. That is an extremely important proof point because it shows:
framing correctness
CRC correctness
serial transport stability
decoder correctness
host-side state continuity
all at once.
Actual Live Metric Values Observed on Real Hardware
Representative values recorded during the validated STM32 run:
rtos_cpu_utilization_ratio = 1rtos_heap_free_bytes = 12568rtos_heap_min_ever_bytes = 12568rtos_telemetry_packet_loss_ratio = 0rtos_heap_oom_projection_seconds = -1
Per-task telemetry was confirmed for:
IDLETelemetryTaskdefaultTaskTmr Svc
Confirmed task stack watermark values:
IDLE = 424 BTelemetryTask = 1560 BTmr Svc = 856 BdefaultTask = 344 B
Interpretation:
CPU accounting flowed end to end
heap was stable
no leak trend was detected in the validated hardware run
telemetry packet loss stayed at zero
task-level telemetry was visible and meaningful
Long-Duration Soak Validation
The STM32 baseline was not only measured in a short run. It was also subjected to a long-duration soak test.
Soak Metadata
Date:
2026-05-12Start time:
2026-05-12 03:06:58End time:
2026-05-12 11:12:40Duration:
8 hours 5 minutes 42 secondsBoard:
NUCLEO-F401REFirmware project:
RTOSTwinF401RE_cleanBridge path:
D:\digital_twin\vnv_final\bridge\main.pyPort:
COM11
Soak Outcomes
bridge remained alive through the run
firmware remained alive through the run
drops=0seq_gaps=0rtos_telemetry_packet_loss_ratio = 0.0rtos_heap_oom_projection_seconds = -1.0rtos_heap_free_bytes = 12568.0metric snapshots captured:
97
This is one of the strongest engineering achievements in the project because it shows the system remained stable over time, not just for a quick demo window.
The compact metrics summary remained stable across the soak window:
That means:
no memory leak trend emerged
transport stability held
the system retained a stable free-heap signature throughout the sampled soak period
Objective 2: Bridge Export Closure
The project also validated the host-side export layer, not just the embedded telemetry generation.
The bridge path was proven to export RTOS metrics through:
Prometheus
OTLP / OpenTelemetry
This was validated for both:
mock-device lane
real STM32 hardware lane
The OTLP-enabled validation confirmed the expected RTOS metric families were exported:
rtos.heap.free_bytesrtos.heap.min_ever_bytesrtos.heap.oom_projection_secondsrtos.cpu.utilization_ratiortos.telemetry.packet_loss_ratiortos.task.statertos.task.stack_watermarkrtos.task.cpu_ratio
This matters because it proves the project is not only a Grafana demo. It is aligned to open observability standards and can integrate with broader metrics ecosystems.
Objective 3: OOM Analyzer Validation
The OOM analyzer was tested across multiple scenarios:
stable system
leaking system
saturated but non-leaking system
OTLP export path
real STM32 hardware
Key outcomes:
analyzer test suite passed
5/5stable mock path remained at
-1.0leak path produced a positive projected OOM value of
1193.3716085975489saturated mock stayed stable at
-1.0real hardware remained stable at
-1.0
This is powerful because it shows the bridge is not merely forwarding numbers. It is beginning to reason about runtime health.
Embeddable Library / API Migration
After the validated STM32 baseline was closed, the project was migrated into an embeddable module so it could be integrated into another STM32 firmware project cleanly.
The new public API exposes a stable lifecycle surface:
rtostwin_init()rtostwin_start()rtostwin_stop()rtostwin_is_running()rtostwin_version()
It also preserves backward compatibility through:
StartTelemetryAgent()
And it supports compile-time feature removal through:
RTOSTWIN_ENABLE = 0
This is important because it upgrades the project from a validated system demo into a reusable firmware component.
Embeddable Architecture
This migration means a consumer firmware project can:
include
rtostwin.hprovide
rtostwin_config.hcall the lifecycle API
compile the telemetry feature out if needed
preserve the validated bridge and wire-format behavior
That makes the project significantly stronger from a product and open-source perspective.
Why the Open-Standards Angle Matters
Many embedded observability solutions are tied to proprietary backends or vendor-specific tooling. RTOSTwin was intentionally built around open standards and composability.
That means:
the MCU remains lightweight
the host-side bridge is understandable and modifiable
the metrics are exposed in widely recognized forms
teams can adopt the project without being trapped in a vendor platform
This is what makes the project interesting not only as firmware work, but as infrastructure and systems design work.
Engineering Trade-Offs the Project Solved
This project is fundamentally a trade-off exercise between observability richness and embedded cost.
It had to balance:
fidelity vs. bandwidth
visibility vs. CPU overhead
state richness vs. RAM usage
correctness vs. serial simplicity
embedded minimalism vs. host-side feature depth
The measured results show those trade-offs landed well on the STM32 baseline:
telemetry remained near the 10 Hz target
CPU cost stayed under 1%
static RAM stayed at 2543 bytes
no dynamic allocation was introduced into the hot path
packet integrity remained stable in real hardware and soak evidence
That is the real technical story of RTOSTwin.
Why This Project Matters
RTOSTwin matters because it connects two worlds that are usually separated:
the world of tiny resource-constrained embedded systems
the world of modern open observability infrastructure
Instead of treating firmware as something that can only be debugged locally with probes and IDE windows, RTOSTwin treats the embedded runtime like an operational system that deserves the same level of continuous insight as backend services.
That is a strong systems idea.
It is also a strong implementation achievement because the project did not stop at:
protocol design
local mock simulation
pretty dashboards
It went all the way through:
clean protocol definition
host-side decoder and exporters
real STM32 firmware integration
ST-LINK flashing
live serial ingest
Prometheus export
Grafana visualization
performance measurement
long-duration soak validation
reusable public API packaging
Final Outcome
RTOSTwin successfully demonstrated that a FreeRTOS-based STM32 microcontroller can be turned into a live digital twin visible through Prometheus, Grafana, and OpenTelemetry without requiring proprietary infrastructure.
The most important proven path in the project is:
NUCLEO-F401RE -> FreeRTOS telemetry firmware -> ST-LINK virtual COM port -> Python bridge -> Prometheus -> Grafana
And the most important measured results are:
Cadence:
9.52 HzCPU overhead:
0.869%Static RAM:
2543 bytesDynamic allocation in hot path:
nonePacket stability:
drops=0,seq_gaps=0Soak duration:
8 hours 5 minutes 42 secondsHeap stability during soak: stable at
12568.0OOM projection during soak: stable at
-1.0
The result is a project that is:
technically deep
systems-oriented
hardware-validated
quantitatively measured
reusable as an embeddable module
and directly aligned with real-world observability engineering
Short Portfolio Summary
If I had to summarize RTOSTwin in one paragraph:
RTOSTwin is a full-stack embedded observability platform that captures live FreeRTOS runtime state on an STM32 microcontroller, compresses and transports that state over a custom telemetry protocol, reconstructs the device model on a Python bridge, and exposes the result as Prometheus and OpenTelemetry metrics powering a live Grafana digital twin. It was validated end to end on real NUCLEO-F401RE hardware, achieved
9.52 Hztelemetry at only0.869%CPU overhead with2543 bytesstatic RAM and zero hot-path allocation, passed an8+ hoursoak run with0 dropsand0 sequence gaps, and was later packaged as a reusable embeddable firmware library/API for integration into other STM32 projects.