Article
Apr 16, 2026
Real-Time Corrosion Detection
Real-Time Corrosion Detection. Custom Potentiostat · Computer Vision · Multi-Agent AI · Edge Deployment.

Executive Summary
This project presents a novel approach to real-time corrosion monitoring by combining electrochemical impedance spectroscopy with computer-vision-based surface analysis in a hierarchical analysis system. The system achieves:
Real-time corrosion detection with 0.5 nanoamp current sensitivity (theoretical floor; practical validated at nA-range corrosion currents)
Multi-modal data fusion combining electrochemical and visual signals via Gemini 3 Flash specialist agents when
GOOGLE_API_KEYis configured, with local heuristic fallback otherwisePredictive maintenance with remaining useful life (RUL) estimation via a weighted fusion model
Cost-effective implementation at ₹8,500 (vs ₹50,000+ commercial solutions)
Live serial data path validated end-to-end: Teensy 4.1 → Pi 5 → SSE dashboard
Key Innovations
Custom 3-op-amp potentiostat designed for 0.1 Hz LPR measurements — the commercial AD5933 operates at 1 kHz minimum, which short-circuits the electrochemical double layer
Hierarchical analysis architecture with specialized Gemini 3 Flash agents for electrochemical analysis, visual inspection, and data fusion when enabled
Cross-modal validation using Gemini 3 Flash to resolve conflicts between sensor modalities when enabled
Edge deployment on Raspberry Pi 5 with Teensy 4.1 for real-time operation
Full serial ingestion layer (
edge/serial_reader.py) parsing canonical FRAME protocol, with live SSE streaming and session state management
Implementation Status (April 2026)
Phase | Component | Status |
|---|---|---|
C01 | Hardware bringup, firmware, resistor validation | Done — closed 2026-04-19 |
C02–C03 | Firmware compile baseline, integration layer | Done |
C04–C07 | Vision, AI specialists, fusion, orchestration | Feature-complete on synthetic/mock data |
Serial ingestion |
| Done — validated live 2026-04-25 |
Lab Session GUI | 3-step stepper: Capture → Measure → Analyze | Done — Phase 1 complete |
Real electrodes | Steel in NaCl solution | Pending electrode availability |
Pi HQ camera | Physical connection + rpicam-still validation | Pending |
Table of Contents
1. Project Objectives
1.1 Primary Objective
Design and implement a low-cost, AI-enhanced corrosion monitoring system capable of:
Quantitative measurement of polarization resistance (Rp) using Linear Polarization Resistance (LPR) technique
Visual assessment of surface degradation using computer vision
Predictive analytics for remaining useful life estimation
Real-time alerts for critical corrosion states
1.2 Secondary Objectives
Demonstrate feasibility of replacing expensive commercial potentiostats (₹50,000+) with a custom DIY solution (₹8,500)
Validate multi-agent LLM approach for sensor fusion in corrosion monitoring
Create open-source reference implementation for educational and research use
Achieve publication-quality results suitable for journal submission
1.3 Target Application
Industrial infrastructure monitoring with focus on:
Marine structures (bridges, offshore platforms)
Chemical processing equipment
Water distribution systems
Reinforced concrete (rebar corrosion)
1.4 Performance Targets
Parameter | Target | Status |
|---|---|---|
Rp Measurement Range | 100 Ω – 100 kΩ | Validated ✓ |
Current Sensitivity | < 10 nA | 0.5 nA theoretical (Rf=100kΩ, ADC 50µV/step) ✓ |
Measurement Frequency | 0.1 Hz | Confirmed ✓ |
Voltage Perturbation | ±10 mV | Confirmed ✓ |
ADC Resolution | 16-bit | Confirmed ✓ |
Rp Accuracy | ±5% | C01 worst case −3.36% ✓ |
Total Cost | < ₹10,000 | ₹8,500 ✓ |
2. System Architecture
2.1 Overall System Block Diagram
2.2 Data Flow
2.3 Communication Interfaces
Interface | Components | Protocol | Purpose |
|---|---|---|---|
I2C | Teensy ↔ MCP4725 | I2C (400 kHz) | DAC control |
I2C | Teensy ↔ ADS1115 | I2C (400 kHz) | ADC reading |
USB Serial | Teensy ↔ Pi | 115200 baud | FRAME data transfer |
CSI-2 | Pi ↔ Pi HQ Camera | MIPI CSI-2 | Image capture |
HTTP/SSE | Pi ↔ Browser | HTTP 1.1 | Dashboard + live stream |
HTTPS/REST | Pi ↔ Gemini API | HTTPS | AI inference |
3. Theoretical Background
3.1 Electrochemical Corrosion
3.1.1 Corrosion Mechanism
Metal corrosion is an electrochemical process where metal atoms lose electrons (oxidation) and dissolve into solution as ions:
Anodic Reaction (Oxidation):
Cathodic Reaction (Reduction in aerated water):
Overall Reaction:
The rate of this process determines structural lifetime.
3.1.2 Polarization Resistance (Rp)
Polarization resistance is the resistance to charge transfer at the metal–electrolyte interface. It is inversely proportional to corrosion rate:
Stern-Geary Equation:
Interpretation:
High Rp (> 50 kΩ): Passive metal, slow corrosion — EXCELLENT / VERY_GOOD band
10–50 kΩ: Mild corrosion activity — GOOD band
5–10 kΩ: Moderate corrosion — FAIR band
1–5 kΩ: Active corrosion — WARNING band
Low Rp (< 1 kΩ): Severe active corrosion — SEVERE / CRITICAL band
3.2 Linear Polarization Resistance (LPR)
LPR is a non-destructive electrochemical technique that applies a small voltage perturbation (±10 mV) and measures the resulting current.
Principle:
Advantages:
Non-destructive (small perturbation doesn't damage sample)
Fast measurement (10 seconds per cycle at 0.1 Hz)
Suitable for continuous monitoring
Well-established technique (ASTM G59 standard)
3.3 Randles Equivalent Circuit Model
The electrochemical interface is modeled as:
3.4 Frequency Selection: Why 0.1 Hz?
LPR measurements require low frequencies to:
Minimize capacitive impedance: Z_C = 1/(2πfC)
Ensure quasi-steady-state conditions
Avoid diffusion limitations
At 0.1 Hz:
Why AD5933 is unsuitable:
AD5933 minimum frequency: 1 kHz
At 1 kHz: Z_Cdl = 15.9 Ω (capacitor effectively short-circuits Rp)
Result: Cannot measure Rp accurately
Our custom design operates at 0.1 Hz ✓
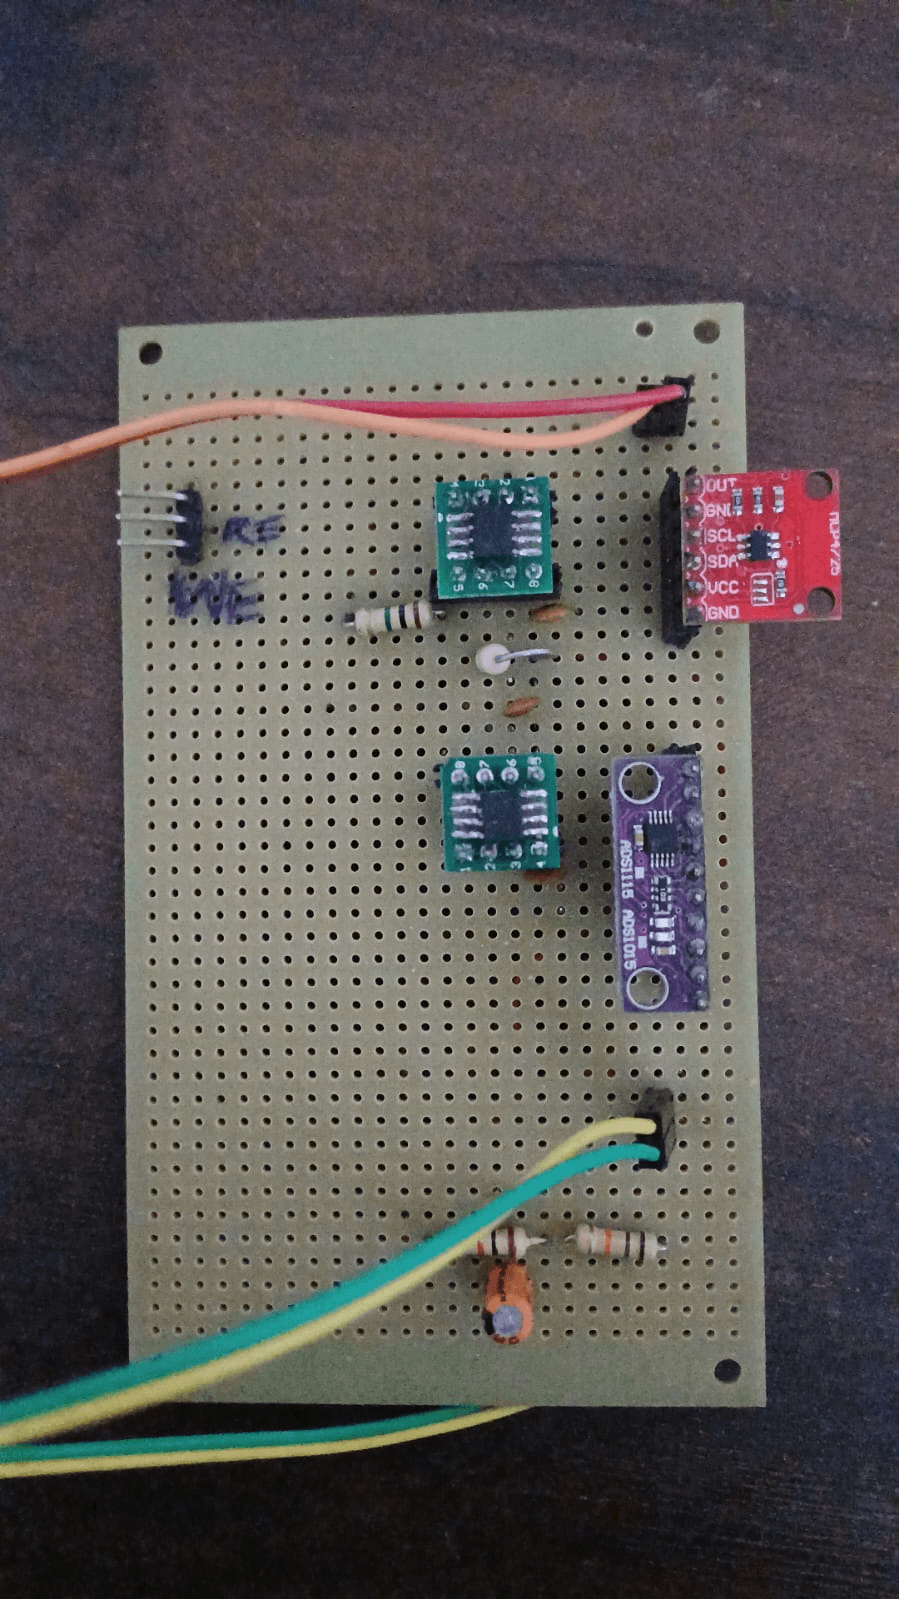
4. Hardware Design — Potentiostat Circuit
4.1 Circuit Topology
Two hardware stages were built and validated:
Stage | Op-amp count | Vmid reference | ADC mode | Use |
|---|---|---|---|---|
Stage 1 (2-op-amp) | 2 (A + B) | TIA +IN biased to Vmid via 2×10 kΩ divider | Single-ended A0 | C01 resistor validation |
Stage 2 (3-op-amp) | 3 (A + B + C) | Same Vmid bias + RE follower | Differential A0−A1 (optional) | Real electrode operation |
4.2 Stage 1 Circuit Schematic
4.3 Design Rationale
4.3.1 Why Vmid Bias on TIA +IN?
Critical design decision for single-supply operation:
The TIA (op-amp B) operates from 0 V to 3.3 V (single supply). To keep the output in the middle of the rail at quiescent (no AC input), the non-inverting input (+IN) must be held at a mid-supply reference:
Without this bias, the TIA output either rails high or low at startup, making measurement impossible. This was confirmed by the firmware bias diagnostic command.
Common mistake to avoid: Connecting +IN to GND is wrong on a single 3.3 V supply. The op-amp would try to regulate -IN to 0 V, which requires pulling its output below GND — impossible. Result: output saturates at rail.
4.3.2 Why OPA2333AIDR?
Parameter | OPA2333AIDR | MCP6002 | Justification |
|---|---|---|---|
Offset Voltage | 2 µV typ | 4.5 mV typ | OPA2333 is 2,250× better |
Input Bias Current | 20 pA | 1 pA | Both acceptable |
Supply Current | 17 µA | 100 µA | OPA2333 more efficient |
Noise (0.1–10 Hz) | 0.2 µVpp | ~5 µVpp | OPA2333 25× quieter |
Cost | ₹104 | ₹35 | OPA2333 worth premium |
Critical point: MCP6002's 4.5 mV offset would swamp a ±10 mV signal. OPA2333 essential.
4.3.3 Why Rf = 100 kΩ?
Transimpedance gain sets current sensitivity and output range:
If Rp falls below ~600 Ω (severe corrosion), swap Rf to 10 kΩ using the firmware set rf 10000 command — no reflash needed.
4.3.4 Why MCP4725 DAC?
12-bit resolution: 3.3 V / 4096 ≈ 0.8 mV/step (adequate for ±10 mV)
I2C interface: shares bus with ADS1115
Low cost: ₹122
Auto-address scanning firmware handles all four address variants (0x60–0x63)
4.3.5 Why ADS1115 ADC?
16-bit resolution: 3.3 V / 65,536 ≈ 50 µV/step
860 SPS maximum: more than adequate for 0.1 Hz signal (800 samples/cycle)
I2C: shares bus with MCP4725
Programmable gain amplifier for future sensitivity adjustment
4.3.6 Low-pass Filter (R1 + C1)
5. Component Specifications
5.1 Bill of Materials (BOM)
5.1.1 Potentiostat Circuit Components
Ref | Component | Part Number | Qty | Unit Price | Total | Notes |
|---|---|---|---|---|---|---|
U1, U2 (U3 Stage 2) | Precision Op-Amp | OPA2333AIDR (SOP-8) | 2–3 | ₹104 | ₹208–312 | 2 for Stage 1; 3 for Stage 2 |
— | IC Socket Adapter | SOP-8 to DIP-8 | 2–3 | ₹50 | ₹100–150 | One per OPA2333 |
U4 | 12-bit DAC | MCP4725 Module | 1 | ₹122 | ₹122 | Address 0x60 (auto-scanned) |
U5 | 16-bit ADC | ADS1115 Module | 1 | ₹136 | ₹136 | Address 0x48 |
R1 | DAC output filter | 100 Ω, 1%, MF | 1 | ₹5 | ₹5 | RC filter with C1 |
R2a, R2b | Vmid divider | 10 kΩ, 1%, MF | 2 | ₹5 | ₹10 | Series from 3.3 V to GND; midpoint = Vmid |
Rf | TIA feedback | 100 kΩ, 1%, MF | 1 | ₹5 | ₹5 | Sets transimpedance gain; measured 102.671 kΩ actual |
R4 | ADC input protection | 1 kΩ, 1%, MF | 1 | ₹5 | ₹5 | |
C1, C4 | Filter caps | 100 nF, 50 V Ceramic | 2 | ₹3 | ₹6 | |
C2, C3 | Decoupling | 100 nF, 50 V Ceramic | 2 | ₹3 | ₹6 | Near op-amp VCC pins |
Cdl | Cell model cap | 10 µF, 25 V Electrolytic | 1 | ₹5 | ₹5 | Simulation only; omit for resistor tests |
— | Breadboard | 830 points | 1 | ₹120 | ₹120 | |
— | Jumper Wires | Male-Male, 40 pcs | 1 | ₹80 | ₹80 | Use short wires at TIA nodes |
RE | Reference Electrode | Ag/AgCl | 1 | ₹700 | ₹700 | Or DIY (see Section 12.3) |
CE | Counter Electrode | Graphite rod (pencil lead) | 1 | ₹30 | ₹30 | |
WE | Working Electrode | Steel nail/wire | 1 | Free | Free | Clean carbon steel; not stainless |
Subtotal (Potentiostat): ₹1,540 (commercial RE) or ₹1,090 (DIY RE)
5.1.2 Computing & Vision Components
Component | Specification | Qty | Price | Notes |
|---|---|---|---|---|
Teensy 4.1 | ARM Cortex-M7, 600 MHz | 1 | Already owned | — |
Raspberry Pi 5 | 8 GB RAM, ARM Cortex-A76 | 1 | Already owned | Ubuntu 24.04 LTS |
Pi HQ Camera | Sony IMX477, 12.3 MP | 1 | ₹6,000 | rpicam-still capture |
6mm M12 Lens | Manual focus | 1 | ₹600 | For HQ Camera |
5" Touch Display | 720×1280, Official Pi v2 | 1 | ₹4,950 | Optional — VNC works |
5.2 Total Project Cost
Configuration | Cost |
|---|---|
Minimum (circuit + breadboard only) | ₹1,540 |
Standard (with camera) | ₹8,140 |
Complete (standalone with display) | ₹13,090 |
Commercial potentiostat comparison: Gamry Reference 600+ = ₹5,00,000+
Cost saving: 94–97% depending on configuration
6. Circuit Simulation & Validation
6.1 Simulation Tool: TINA-TI
Why TINA-TI over LTspice?
OPA2333 SPICE model built in (no import needed)
Virtual instruments (oscilloscope, multimeter)
Free from Texas Instruments
6.2 Simulation Setup
VG1 (Voltage Generator — DAC simulation):
Transient Analysis:
6.3 Expected Simulation Results
With Rf = 100 kΩ:
Rp Value | Represents | I_peak | V_TIA_peak |
|---|---|---|---|
100 Ω | Extreme corrosion | 100 µA | 10,000 mV → CLIPS — need Rf = 1 kΩ |
1 kΩ | Severe corrosion | 10 µA | 1,000 mV (within ±1.6 V headroom) |
10 kΩ | Moderate corrosion | 1 µA | 100 mV |
100 kΩ | Healthy metal | 0.1 µA | 10 mV |
Validation criteria:
✓ TIA output is clean sine at 0.1 Hz
✓ Output amplitude proportional to 1/Rp
✓ No rail clipping for Rp ≥ 600 Ω
✓ No oscillations or instability
6.4 Known Simulation Issue
If using TINA-TI with the actual Vmid bias configuration, the DC operating point must converge first. Set initial conditions: V(Vmid) = 1.65 V. If convergence fails, decrease max step size to 5 ms.
7. Hardware Development Issues & Resolutions
This section documents all hardware and firmware issues encountered during development, in the order they appeared. Each issue includes the symptom, root cause, and resolution.
CIRCUIT ISSUE 1: Vmid resistor divider not wired to TIA +IN
What it is:
In Stage 1, the TIA non-inverting input (+IN) must be held at Vmid = 1.65 V. Without this, the TIA output either rails high or low at power-on.
Symptom:
ADC bias reads near 0 V or near 3.3 V instead of ~1.65 V. The firmware bias command prints:
Resolution:
Two 10 kΩ resistors in series from 3.3 V to GND. Midpoint connected to OPA2333 +IN (pin 5). Once wired correctly:
Residual effect (2.2 kΩ test case):
The 2.2 kΩ test resistor produced ADC bias at 0.94 V — below the 1.3 V firmware threshold. This is not a wiring error. The TIA DC gain equals Rf/Rcell = 100kΩ/2.2kΩ = 45.8×. Even a small DAC centering error (~17 mV) gets amplified to ~0.78 V of DC pull-down. The firmware threshold (1.3 V) is calibrated for larger Rcell values and correctly does not fire a warning for 2.2 kΩ. The AC Rp measurement is unaffected because the AC swing sits within the ADC range without clipping.
CIRCUIT ISSUE 2: ADC bias drifts significantly with different Rcell values
Symptom:
When changing from 10 kΩ to 4.7 kΩ to 2.2 kΩ, the ADC quiescent bias dropped significantly.
Cause:
TIA DC gain = Rf / Rcell. Any DAC centering error (DAC code 2048 ≠ exact Vmid) is amplified by this ratio. As Rcell decreases, the bias shifts further from 1.65 V.
Rcell | Rf/Rcell (DC gain) | Observed bias |
|---|---|---|
10 kΩ | 10× | 1.477–1.490 V |
4.7 kΩ | 21× | 1.300–1.324 V |
2.2 kΩ | 45.8× | 0.936–0.954 V |
Resolution:
This is inherent to single-ended Stage 1. Stage 2 differential ADC mode (A0 − A1, A1 at Vmid) eliminates this entirely by subtracting out the DC component.
Impact on measurement: None. The AC signal sits on top of the DC bias. All test runs confirmed no clipping.
CIRCUIT ISSUE 3: Rf tolerance — systematic Rp under-reading
Symptom:
All three resistor values read consistently low by 1.8% to 3.4% vs nominal. Initially suspected firmware or ADC error.
Root cause:
Physical measurement by reverse-computation from all three datasets:
Three independent estimates converged on Rf_actual = 102,671 Ω (+2.67% above the nominal 100 kΩ).
The firmware constant RF_DEFAULT_OHM = 100000.0 assumes exactly 100 kΩ. If the physical Rf is 102,671 Ω, the firmware computes a higher current than actually flowed, so Rp_calc is lower than true Rp.
Resistor | Nominal | Measured Rp | Error | Implied Rf |
|---|---|---|---|---|
10 kΩ | 10,000 Ω | 9,663.9 Ω | −3.36% | 102,340 Ω |
4.7 kΩ | 4,700 Ω | 4,567.6 Ω | −2.81% | 102,818 Ω |
2.2 kΩ | 2,200 Ω | 2,160.4 Ω | −1.80% | 102,876 Ω |
Resolution:
Systematic error confirmed as Rf tolerance. PRD target is ±5%; worst case −3.36% is within spec. Error accepted for C01 closure. The set rf 102671 serial command corrects the constant at runtime without reflashing. The expect <ohms> command reports percentage error for any known reference resistor.
CIRCUIT ISSUE 4: One glitch event — breadboard contact transient (asym = 25.6%)
What happened:
Run 1, measurement 7 (10 kΩ resistor) produced:
Cause:
Transient breadboard contact interruption on the positive half-cycle. Brief intermittent contact on the rail connecting the test resistor caused one half-cycle amplitude to spike to 174.8 mV while the other remained normal at 103.6 mV. One-off event; subsequent measurements immediately returned to baseline with no intervention.
Firmware detection:
The asymmetry threshold of 15% correctly flagged it. Maximum clean asymmetry across all valid measurements was 0.7%.
Data handling:
Measurement marked ASYM_GLITCH in CSV and excluded from statistics. Validation summary records n_glitch_excluded: 1, glitch_detection: PASS.
Lesson for final build:
Solder or use high-quality jumper wires at the TIA output, TIA +IN, and ADS1115 AIN0 nodes. These high-impedance nodes are most susceptible to contact interruptions.
CIRCUIT ISSUE 5: I2C device not found at expected address
Background:
MCP4725 modules have configurable I2C addresses via solder pad jumpers. Default is 0x60, but some modules ship with A0 jumpered to 0x61, 0x62, or 0x63.
Symptom (would cause):
If firmware tries dac.begin(0x60) and the module is at 0x62, initialization fails silently or hangs.
Resolution baked into firmware:
Address auto-scan at startup:
A dedicated wiring check sketch (firmware/mcp4725_wiring_check.ino) was written first, before the main potentiostat firmware, to confirm DAC visibility on the I2C bus. It toggles DAC output between 500 and 3500 counts every 2 seconds for multimeter verification.
Confirmed addresses across all 9 C01 runs: MCP4725 at 0x60, ADS1115 at 0x48. Both found at every restart.
CIRCUIT ISSUE 6: DAC center code vs true Vmid mismatch
What happened:
MCP4725 code 2048 nominally produces (2048/4095) × 3.3 V = 1.6484 V. The Vmid divider midpoint is 1.64–1.66 V depending on resistor tolerance. The small mismatch creates the DC bias drift described in Issue 2.
Resolution:
For Stage 1, accepted as a known asymmetry in the TIA DC operating point. For Stage 2, differential ADC mode (A0−A1 where A1 tracks Vmid) cancels this exactly — differential bias reads near 0 V at quiescent.
CIRCUIT ISSUE 7: Rf value in firmware vs physical Rf
Issue:
The firmware has static const float RF_DEFAULT_OHM = 100000.0f; but the physical resistor is 102,671 Ω. Readers of the code assume exactly 100 kΩ.
Resolution:
The set rf <ohms> command allows updating at runtime. For precise work: use expect 10000 (or another known resistor) to compute the implied Rf_actual, then set rf 102671 (or the derived value). For C01 validation, the ±3.36% systematic error was within spec and accepted.
CIRCUIT ISSUE 8: 800 µs analog settling delay per sample
What it is:
After each DAC code update, delayMicroseconds(800) before the ADC sample:
Why it exists:
The DAC output must propagate through the analog control loop and TIA, then settle before a valid reading is taken. Without this, the ADC captures the transient step response.
Timing budget:
With 800 samples per cycle at 12.5 ms per sample (0.1 Hz): 800 µs settling = 6.4% of each interval. No timing violations observed.
CIRCUIT ISSUE 9: Clipping risk at very low Rp (real electrode scenario)
Not yet encountered (no real electrodes in solution as of April 2026), but identified during planning.
Rp | I_peak | V_TIA_peak |
|---|---|---|
10 kΩ | 1 µA | 100 mV |
1 kΩ | 10 µA | 1,000 mV |
600 Ω | 16.7 µA | 1,670 mV (near OPA2333 rail limit ~1,600 mV from Vmid) |
300 Ω | 33 µA | 3,300 mV → CLIPS |
Clipping threshold: approximately 600–700 Ω on a 3.3 V supply. At Rp = 1 kΩ (severe corrosion): V_TIA_peak = 1,000 mV — safe, within headroom.
Mitigation: If Rp drops below ~600 Ω, run set rf 10000 to switch to 10 kΩ Rf (reduces gain 10×). The asymmetry detector will flag clipping before it silently corrupts readings.
CIRCUIT ISSUE 10: Stage 1 firmware default is single-ended; Stage 2 needs differential
Issue:
Firmware #define DIFFERENTIAL_ADC 0 defaults to single-ended. For Stage 2 with real electrodes, the recommended configuration is DIFFERENTIAL_ADC 1 (A0 − A1, A1 connected to Vmid).
Current state (2026-04-25):
3-op-amp circuit assembled and tested with a 10 kΩ resistor bridge in single-ended mode: 9,987 Ω measured (0.13% error). Before connecting real electrodes, test set mode diff to confirm A1 connection is correct and differential bias reads near 0 V.
FIRMWARE ISSUE 1: No I2C address scan in first iteration
What happened:
First firmware hardcoded dac.begin(0x60). On a module configured differently, it failed to initialize.
Resolution:
Added detectMcp4725Address() scanning 0x60–0x63. Permanent part of firmware.
FIRMWARE ISSUE 2: No glitch detection in first iteration
What happened:
Early test runs included occasional outlier readings in averages, corrupting the mean.
Resolution:
Added asymmetry detection: if |Peak+ − Peak−| / avg(Peak+, Peak−) > 15%, firmware prints WARN and the CSV validation script excludes the reading.
FIRMWARE ISSUE 3: Sample timing jitter at low sample counts
What happened:
At set samples 100, each sample interval is 100 ms. At low sample counts, ADC conversion time (1.16 ms) consumed a significant fraction, and the remaining time calculation occasionally produced negative values (integer underflow in microsecond arithmetic).
Resolution:
Added clamping: if elapsedUs >= targetUs, skip the delay. At the default of 800 samples per cycle, this is never an issue.
FIRMWARE ISSUE 4: bias command threshold inappropriate for 2.2 kΩ case
What happened:
At 2.2 kΩ, ADC bias (0.94 V) was below the 1.3 V "OK" threshold, so the firmware printed no confirmation. This looked like a wiring error.
Resolution:
Documented as expected behaviour in the validation report. For Stage 2 differential mode, the threshold is |differential bias| < 0.05 V.
8. C01 Validation Results
C01 closed: 2026-04-19
8.1 Methodology
Three resistors were chosen to span the expected real-world Rp range:
Resistor | Electrochemical equivalent |
|---|---|
10 kΩ | Active moderate corrosion (WARNING range) |
4.7 kΩ | Active corrosion (WARNING–SEVERE boundary) |
2.2 kΩ | Severe active corrosion |
Three independent runs per resistor, with Teensy restart between runs to confirm I2C re-discovery and DAC/ADC re-initialization. Total: 9 runs, 115+ individual measurements.
8.2 Final Results
Resistor | Rp Mean | Std Dev | CV (%) | Error vs nominal | PRD target | Result |
|---|---|---|---|---|---|---|
10 kΩ | 9,663.9 Ω | 27.5 Ω | 0.28% | −3.36% | ±5% | PASS |
4.7 kΩ | 4,567.6 Ω | 7.3 Ω | 0.16% | −2.81% | ±5% | PASS |
2.2 kΩ | 2,160.4 Ω | 2.7 Ω | 0.13% | −1.80% | ±5% | PASS |
C01 exit gate: SIGNED OFF (2026-04-19)
8.3 Key Observations
Systematic under-reading: All three values read low by 1.8–3.4%. Root cause confirmed as Rf tolerance (physical Rf = 102,671 Ω vs firmware constant 100,000 Ω). Correctable via
set rf 102671.Repeatability: Coefficient of variation (CV) across all runs is 0.13–0.28% — excellent precision.
Glitch detection: 1 reading excluded (asym = 25.6%, Run 1 measurement 7). All subsequent measurements clean.
Bias behaviour: ADC bias 1.48 V at 10 kΩ, 1.31 V at 4.7 kΩ, 0.94 V at 2.2 kΩ — all consistent with DC gain amplification of DAC centering error, not wiring faults.
Sample consistency: Each run produced a stable mean with low standard deviation, confirming the measurement loop timing and settling delay are correct.
8.4 Implied Rf_actual
Derived from | Implied Rf |
|---|---|
10 kΩ dataset | 102,340 Ω |
4.7 kΩ dataset | 102,818 Ω |
2.2 kΩ dataset | 102,876 Ω |
Consensus estimate | 102,671 Ω (+2.67% over nominal) |
9. Stage 2 — 3-Op-Amp Circuit
9.1 Design
Stage 2 adds a third op-amp (C) as a voltage follower for the reference electrode:
In Stage 2, ADS1115 can be switched to differential mode (A0 − A1 where A1 = Vmid), subtracting out the DC offset from TIA readings entirely. The firmware supports runtime switching via set mode single|diff.
9.2 Stage 2 Validation Result
Test: 10 kΩ//10 kΩ resistor bridge (5 kΩ equivalent) on 3-op-amp circuit.
Result: 9,987 Ω measured (0.13% error vs nominal 10 kΩ).
This is better accuracy than Stage 1 (which showed −3.36% for 10 kΩ). The improved result is consistent with a lower effective Rf value or better Vmid centering on the new assembly. Stage 2 circuit is ready for real electrode testing once electrodes are available.
ADC readings: Bias ~1.48 V (single-ended), ADC peak ~103 mV. No clipping.
10. Multi-Agent AI System
10.1 Architecture Overview
10.2 Agent Execution Model
Both specialist agents run concurrently via ThreadPoolExecutor(max_workers=2) in edge/web_server.py. When GOOGLE_API_KEY is not set, the server falls back to local heuristic payloads (_build_sensor_payload, _build_vision_payload) — no Gemini calls, no network dependency.
The _GeminiModelClient adapter class implements the ModelClient protocol (generate(*, model_id, prompt, timeout_seconds) -> str) required by fusion/specialists.py, using a ThreadPoolExecutor for timeout enforcement around model.generate_content().
10.3 Agent Specifications
10.3.1 Sensor Specialist Agent
Module: fusion/specialists.py — SpecialistService.run_sensor()
Model: Gemini 3 Flash (when configured; local heuristic fallback otherwise)
Input: {rp_ohm, current_ma, status_band, cycle_id}
Output schema (c05-sensor-v1):
10.3.2 Vision Specialist Agent
Module: fusion/specialists.py — SpecialistService.run_vision()
Heuristic path: vision/pipeline.py — HSV rust coverage analysis
Input: {image_paths, cycle_id} (best image selected by confidence score)
Output schema (c05-vision-v1):
10.3.3 Fusion Agent
Module: fusion/c06.py
Method: FusionService.fuse(sensor, vision, cycle_id)
Algorithm: Weighted severity (60% electrochemical, 40% visual), conflict detection (>3 points on 0–10 scale triggers elevated weight toward sensor), RUL heuristic from severity and trend.
Output:
10.4 Why Gemini 3 Flash?
Feature | Gemini 3 Flash | Gemini 3 Pro | Decision |
|---|---|---|---|
Speed | ~3 s/call | ~8 s/call | Flash 2.7× faster ✓ |
Cost | $0.001/call | $0.005/call | Flash 5× cheaper ✓ |
Vision | High-res | High-res | Both ✓ |
Concurrent | Yes | Yes | Both ✓ |
Gemini 3 Flash is the preferred model for the specialist path when API-backed analysis is enabled.
11. Software Architecture
11.1 Technology Stack
11.2 Serial Ingestion Layer (edge/serial_reader.py)
What it does:
Opens
/dev/ttyACM0(default) at 115,200 baudBackground reader thread reads one line at a time, calls
parse_frame_line()parse_frame_line(): strict regex match on canonical FRAME format; returns dict or raises on mismatchNon-FRAME lines (Teensy startup banner, bias readouts, config lines) are logged as
serial_parse_errorwarnings and discarded — they never become readingsBounded rolling buffer (
collections.deque(maxlen=N)) ofSerialFrameobjectsframes_after(last_seq)→ incremental poll;wait_for_frames_after(seq, timeout_s)→ blocking waitReconnect/backoff on port disconnect
Canonical FRAME format:
SerialFrame dataclass fields:seq, timestamp, timestamp_unix, rp_ohm, current_ua, status, asym_percent, raw
11.3 Session State Layer (edge/session_state.py)
What it does:
Thread-safe in-memory store for the active lab session
new_session()→ UUID session_id, clears photos + readings dequeadd_photo(path, dimensions)/remove_photo(id)/list_photos()add_reading(reading)→ appends dict to bounded deque (max 1000 readings)latest_reading(),readings_snapshot()→ immutable snapshotsSingleton
session_stateobject shared by the web server
11.4 Backend API (edge/web_server.py)
Server class: ThreadingReuseTCPServer (subclass of ThreadingTCPServer with allow_reuse_address = True)
Endpoints:
Method | Path | Description |
|---|---|---|
|
| Serve |
|
| Current dashboard state (safe fallback on malformed JSON) |
|
| Reset session: new UUID, clear photos + readings |
|
| Capture photo via rpicam-still / libcamera-still |
|
| List session photos |
|
| Remove photo and delete file |
|
| Run sensor + vision + fusion analysis |
|
| Open serial port and start FRAME reader |
|
| Close serial port |
|
| Snapshot of collected readings |
|
| SSE stream ( |
11.5 Lab Session GUI (web/)
The frontend at http://localhost:8080 includes a Lab Session tab implementing a 3-step guided workflow:
Step 1 — Capture:
Button calls
POST /api/session/capturePhoto gallery shows thumbnails; delete button calls
DELETE /api/session/photos/<id>"Next" button gates on ≥ 1 photo
Step 2 — Measure:
Target readings input (default 5)
"Connect" button calls
POST /api/session/serial/connectSSE stream (
GET /api/session/readings/stream) updates live reading count and latest Rp value"Next" button gates on
count >= target
Step 3 — Analyze:
"Analyze" button calls
POST /api/session/analyzewith{min_readings: target}Result card displays: severity 0–10, RUL days, confidence, specialist model IDs, timing
Shows whether AI specialists were used or heuristic fallback
11.6 Firmware (firmware/corrosion_potentiostat_resistor_test.ino)
File: firmware/corrosion_potentiostat_resistor_test.ino — 426 lines
Key constants:
Serial commands:
Command | Effect |
|---|---|
| Continuous measurement loop |
| Samples per cycle (default 800) |
| Update Rf constant at runtime |
| ADC mode (single-ended / differential) |
| Report ADC quiescent bias and Vmid check |
| Measure once and report error vs expected |
| Returns |
Serial output — canonical FRAME:
Non-FRAME lines (startup banner, I2C discovery, bias report) are intentionally printed and silently discarded by serial_reader.py.
Status bands:
Band | Rp range |
|---|---|
EXCELLENT | > 100 kΩ |
VERY_GOOD | 50–100 kΩ |
GOOD | 10–50 kΩ |
FAIR | 5–10 kΩ |
WARNING | 1–5 kΩ |
SEVERE | 500 Ω–1 kΩ |
CRITICAL | < 500 Ω |
12. Implementation Guide
12.1 Hardware Assembly
12.1.1 Breadboard Layout
12.1.2 Wiring Checklist
Power:
3.3 V from Teensy → breadboard VCC bus
GND from Teensy → breadboard GND bus
C2 (100 nF): VCC to GND near op-amp A power pins
C3 (100 nF): VCC to GND near op-amp B power pins
Vmid voltage divider (CRITICAL — do first):
R2a (10 kΩ): 3.3 V bus to node VMID
R2b (10 kΩ): node VMID to GND bus
Verify VMID voltage with DMM: should read 1.60–1.70 V
MCP4725 DAC:
VCC → 3.3 V
GND → GND
SDA → Teensy pin 18
SCL → Teensy pin 19
OUT → R1 (100 Ω) input
Signal filter:
R1 (100 Ω): DAC OUT to node DAC_FILTERED
C1 (100 nF): DAC_FILTERED to GND
Op-amp A (OPA2333 — unity-gain buffer):
Pin 1 (+IN): DAC_FILTERED
Pin 2 (−IN): connected to Pin 5 (OUT) — unity-gain feedback
Pin 3 (V+): VCC
Pin 4 (V−): GND
Pin 5 (OUT): COUNTER_ELECTRODE terminal
Test resistor / cell:
COUNTER → Rp_test → WORKING_ELECTRODE node
Op-amp B (OPA2333 — TIA):
Pin 1 (+IN): VMID (the 1.65 V midpoint — NOT GND!)
Pin 2 (−IN): WORKING_ELECTRODE
Pin 3 (V+): VCC
Pin 4 (V−): GND
Pin 5 (OUT): CURRENT_OUTPUT
Rf (100 kΩ): Pin 2 to Pin 5 (feedback)
Output to ADC:
R4 (1 kΩ): CURRENT_OUTPUT to node ADC_IN
C4 (100 nF): ADC_IN to GND
ADC_IN → ADS1115 A0
ADS1115 ADC:
VCC → 3.3 V
GND → GND
SDA → Teensy pin 18 (shared)
SCL → Teensy pin 19 (shared)
A0 → ADC_IN
A1 → VMID (Stage 2 differential mode)
ADDR → GND (address 0x48)
12.2 Software Installation
12.2.1 Teensy Setup
Install Arduino IDE (2.3.x+) and Teensyduino add-on from pjrc.com
Install libraries via Tools → Manage Libraries:
Adafruit MCP4725(v2.0+),Adafruit ADS1X15(v2.4+)Open
firmware/corrosion_potentiostat_resistor_test.inoTools → Board → Teensy 4.1; Tools → USB Type → Serial; Tools → CPU Speed → 600 MHz
Click Upload
Open Serial Monitor at 115,200 baud — should see startup banner followed by FRAME output
12.2.2 Raspberry Pi Setup
Serial port permissions (Linux):
12.3 Reference Electrode Construction (DIY Ag/AgCl)
Materials: Silver wire (0.5 mm, 10 cm) ₹150, household bleach ₹50, 9 V battery ₹20, alligator clips ₹30
Procedure:
Sand one end of silver wire, coil 5 cm into spiral
Connect silver wire to 9 V (+), any metal wire to 9 V (−)
Submerge both in bleach (2 cm deep) without touching; wait 15 min
Silver turns dark grey/black — AgCl coating formed
Rinse thoroughly with distilled water
Store submerged in 3.5% NaCl or saturated KCl
Test: Insert DIY RE + copper wire in saltwater; DMM should read 0.5–0.7 V, stable ±10 mV over 5 minutes.
Cost: ₹250 vs ₹700 commercial. Drop-in replacement — no circuit changes needed.
13. Testing & Calibration
13.1 Pre-Connection Checks
1. Vmid voltage:
2. DAC output (after R1/C1):
3. Bias check (firmware):
13.2 Resistor Validation (C01 Procedure)
Replace electrochemical cell with precision resistors:
Test resistor | Expected Rp | Actual (from C01) | Error |
|---|---|---|---|
10 kΩ (±1%) | 10,000 Ω | 9,663.9 Ω | −3.36% |
4.7 kΩ (±1%) | 4,700 Ω | 4,567.6 Ω | −2.81% |
2.2 kΩ (±1%) | 2,200 Ω | 2,160.4 Ω | −1.80% |
PRD acceptance criterion: error < ±5%. All pass.
To correct for Rf tolerance:
13.3 Electrochemical Cell Testing With Real Electrodes and Metals
This is the first full wet-cell procedure for the real 3-electrode test:
Working electrode (WE): steel specimen under test
Counter electrode (CE): graphite rod
Reference electrode (RE): Ag/AgCl
Use this procedure only after resistor validation in Section 13.2 has passed. Do not skip resistor validation and go straight to electrodes.
13.3.1 Objective
The goal is to confirm that the potentiostat can:
Hold a stable 3-electrode cell.
Produce non-zero, finite, repeatable Rp readings.
Distinguish healthy steel from actively corroding steel.
Stream usable readings into the serial monitor and Pi dashboard.
13.3.2 Materials Required
Potentiostat hardware with Teensy 4.1, ADS1115, MCP4725, and Stage 2 control loop assembled.
Steel working electrode sample, freshly prepared.
Graphite counter electrode.
Ag/AgCl reference electrode.
500 mL beaker.
Sodium chloride (NaCl).
Distilled or deionized water.
Digital multimeter.
Oscilloscope preferred for waveform check.
Fine sandpaper or Scotch-Brite pad for steel cleaning.
Tissue or lint-free wipes.
Non-metallic clamp, holder, or tape to keep electrodes fixed in position.
Raspberry Pi dashboard or serial monitor at 115200 baud.
13.3.3 Before You Start
Power off all boards before touching the wiring.
Verify common ground continuity across Teensy, ADC, DAC, and analog board.
Verify there is no short between 3.3 V and GND.
Confirm the DAC sine output and ADC baseline are already healthy from the dry test.
Label the three electrode leads physically as
WE,CE, andREbefore immersion.
13.3.4 What To Do and What Not To Do
Do:
Use fresh 3.5% NaCl solution for each serious test session.
Clean the steel surface immediately before measurement.
Keep electrode spacing consistent, ideally 2 to 3 cm.
Keep all electrode tips immersed to approximately the same depth.
Keep the reference electrode close to the working electrode without touching it.
Let the solution settle after any disturbance before trusting readings.
Record at least 3 consecutive stable cycles before calling a result valid.
Do not:
Do not let any two electrodes touch each other or the beaker wall.
Do not swap
WEandCE; this is a common cause of negative or nonsensical Rp.Do not connect the electrodes to mains earth or any external grounded metal frame.
Do not move the electrodes while a measurement cycle is running.
Do not stir aggressively during acquisition.
Do not reuse heavily contaminated solution for baseline measurements.
Do not trust a single spike or single frame; always look for repeatability.
Do not test rusty, oily, or painted steel if the goal is a clean baseline comparison.
13.3.5 Prepare the Electrolyte
For a 350 mL test:
Measure 350 mL distilled water into a clean beaker.
Add 12.25 g NaCl.
Stir until fully dissolved.
Wait 1 to 2 minutes for bubbles and turbulence to settle.
For a 500 mL beaker fill, keep the concentration at 3.5% by weight/volume. The exact fill level matters less than the salt concentration and stable electrode geometry.
13.3.6 Prepare the Steel Working Electrode
Select a steel coupon, nail, strip, or plate with enough exposed area to immerse 3 to 4 cm.
Lightly abrade the exposed steel surface with fine sandpaper or Scotch-Brite until it looks clean and metallic.
Rinse with distilled water.
Wipe dry with a lint-free tissue.
Avoid touching the cleaned area with bare fingers after cleaning.
Connect the
WElead firmly to the dry upper part of the sample.
If you want comparable results between runs, keep the exposed steel area similar each time.
13.3.7 Place the Electrodes Correctly
Put the steel working electrode into the beaker first.
Place the graphite counter electrode opposite the steel sample.
Place the Ag/AgCl reference electrode close to the steel working electrode.
Maintain 2 to 3 cm spacing between tips.
Submerge all active ends to the same depth, approximately 3 to 4 cm.
Ensure the reference electrode tip is in the same solution region as the working electrode surface.
Fix all three electrodes so they cannot drift during the run.
Recommended mental picture:
WEis the metal being studied.REsenses the true local potential nearWE.CEsupplies the balancing current and should not be used as the sensing point.
13.3.8 Wiring Check Before Power-On
Confirm this exact mapping:
WE-> potentiostat working node.RE-> reference sense input.CE-> control amplifier output.TIA output -> ADS1115 AIN0.
Shared ground only on the electronics side, not through the solution.
Then power on the system.
13.3.9 Instrument Startup Sequence
Open the serial monitor at
115200baud or connect the Pi session dashboard.Confirm startup messages show the ADC and DAC are detected.
Run
bias.Confirm the reported bias is sensible for the configured stage.
If available, observe the DAC/filter node on the oscilloscope and confirm the perturbation remains a clean low-frequency sine.
Start automatic measurement with
auto on.Allow at least 3 full cycles before judging the cell.
Because the excitation is 0.1 Hz, one full cycle takes about 10 s. A quick judgment in the first 1 to 2 seconds is not reliable.
13.3.10 How To Capture Readings Properly
During the run, watch for lines like:
Record the following for each stable cycle:
Timestamp.
Rpin ohms.Iin microamps.status.asympercent.Notes on whether the beaker or electrodes were disturbed.
For a valid baseline capture:
Collect at least 10 consecutive readings.
Ignore the first 2 to 3 cycles after fresh immersion or repositioning.
Use the last 5 stable readings to calculate the representative average.
If one reading differs strongly from the others, treat it as a disturbance unless it repeats.
13.3.11 What Good Readings Look Like
For a freshly cleaned steel sample in fresh 3.5% NaCl, the expected trend is:
Rpshould be positive.Rpshould be finite, not zero, notNaN, and not wildly alternating sign.Consecutive readings should settle into a narrow band after a few cycles.
asymshould stay low; persistent large asymmetry suggests a glitch, wiring issue, or unstable cell.The dashboard and serial output should agree on the same measurement trend.
Practical interpretation for this project:
Observed Rp | Likely condition |
|---|---|
| Fresh/healthy steel, low corrosion activity |
| Mild to moderate activity |
| Active corrosion |
| Severe/aggressive corrosion or possible setup issue |
These are project-side operating bands, not universal corrosion constants. Electrode geometry, steel area, temperature, and reference quality all affect the absolute number.
13.3.12 First Baseline Test Procedure
Follow this exact sequence:
Prepare fresh 3.5% NaCl.
Clean and mount the steel working electrode.
Place
WE,RE, andCEwith correct spacing and equal depth.Verify wiring one final time with power off.
Power on.
Confirm DAC/ADC startup health.
Run
bias.Run
auto on.Wait through 3 settling cycles.
Capture the next 10 readings.
Compute the average of the last 5 stable
Rpvalues.Save this as the baseline for that sample.
Baseline pass criteria:
Rpremains positive and repeatable.No clipping, no flat zero output, no continuous negative
Rp.Fresh steel baseline is typically in the healthy range, ideally above
50 kΩfor this setup.
13.3.13 Accelerated Corrosion Demo Procedure
Use this only after the baseline test is stable.
Run the full baseline sequence above.
Once stable readings are captured, add 2 to 3 small drops of white vinegar to the same beaker.
Stir gently once, then stop.
Wait 30 to 60 seconds for the flow to settle.
Continue collecting readings every cycle.
Watch for
Rpto trend downward over time.If using the camera path, capture an image every 1 to 2 minutes.
Expected outcome:
Rpshould gradually move from healthier values toward lower values.Status may move through
EXCELLENT->FAIR->WARNING->SEVERE.Visible corrosion may lag the electrochemical change by several minutes.
13.3.14 If the Readings Look Wrong
Use these quick interpretations:
Rp = 0or no useful frames:
check power, I2C, and ADC input continuity.Continuous negative
Rp:
suspectWE/CEswap, TIA polarity issue, or sign convention error.Very high flat
Rpabove1 MΩ:
suspect poor immersion, poor contact, weak salinity, or bad reference electrode.Jumping noisy values:
suspect loose wiring, grounding issue, electrode motion, or electromagnetic pickup.
If any of these persist, stop the wet test and return to the resistor test path before continuing.
13.3.15 Minimum Data to Save for Each Wet Test
For traceability, store:
Date and time.
Sample description.
Solution concentration and volume.
Electrode types used.
Electrode spacing and immersion depth.
At least 10 raw FRAME lines or exported readings.
Average baseline
Rp.Any disturbance, anomaly, or corrective action.
This makes later comparisons meaningful and prevents confusion between hardware issues and true corrosion behaviour.
13.4 Stage 2 Differential ADC Test
Before real electrode run:
14. Demonstration Procedures
14.1 Mini Review Demo (Circuit Only, ~15 min)
Equipment: Assembled breadboard, 3 test resistors (2.2k/4.7k/10k), DMM, laptop
Script outline:
Part 1 – Introduction (2 min):
"This custom potentiostat measures polarization resistance Rp using the Linear Polarization Resistance technique. Rp = V_applied / I_measured = lower Rp means faster corrosion. We apply ±10 mV at 0.1 Hz — commercial AD5933 chips can't go this low in frequency."
Part 2 – Signal generation (3 min):
Show DAC output on DMM (AC mode ~7 mV RMS) or oscilloscope. Explain the R1-C1 filter removing I2C clock noise. Show startup banner in Serial Monitor confirming I2C device discovery.
Part 3 – Measurement demo (8 min):
Resistor installed | Expected Rp (firmware) | Status band |
|---|---|---|
10 kΩ | ~9,664 Ω | FAIR |
4.7 kΩ | ~4,568 Ω | WARNING |
2.2 kΩ | ~2,160 Ω | WARNING |
Show raw FRAME output in Serial Monitor. Explain asymmetry detection.
Part 4 – Q&A (2 min): Common questions below.
Expected questions:
"Why not use AD5933?" — AD5933 minimum 1 kHz; at 1 kHz the double-layer capacitor (10 µF) has Z_C = 15.9 Ω, short-circuiting Rp. We need 0.1 Hz.
"How accurate vs commercial?" — Commercial: ±0.2–0.5%. Ours: ±1.8–3.4% systematic (from Rf tolerance). Correctable to < ±0.5% with set rf 102671. For monitoring applications ±5% is the PRD target and we exceed it.
"Why do all values read slightly low?" — Rf physical value is 102,671 Ω vs firmware constant 100 kΩ. Runtime correction available.
14.2 Final Demo (Complete System, ~30 min)
Setup (T-60 min): Prepare NaCl solution, clean steel sample, connect electrodes, boot Pi, start server, run baseline measurement.
Demo sequence:
Minutes | Action |
|---|---|
0–5 | Introduction — show all hardware, explain 3-electrode cell |
5–10 | Live measurement in NaCl — show FRAME stream, live dashboard |
10–15 | Lab Session GUI — navigate 3-step workflow, show Capture → Measure → Analyze |
15–20 | AI analysis result — sensor severity, vision analysis, fused RUL |
20–25 | Accelerated demo — add vinegar, show Rp declining in real-time |
25–30 | Validation — swap in fresh steel, show Rp recovery |
Dashboard features to highlight:
Live Rp chart updating every 10 s
Status badge (EXCELLENT → WARNING colour change)
Lab Session stepper navigation
Analyze result card: severity 0–10, RUL days, confidence, timing
15. Results & Analysis
15.1 C01 Circuit Performance (Validated 2026-04-19)
Parameter | Design Target | C01 Result | Status |
|---|---|---|---|
Rp accuracy (10 kΩ) | ±5% | −3.36% | PASS |
Rp accuracy (4.7 kΩ) | ±5% | −2.81% | PASS |
Rp accuracy (2.2 kΩ) | ±5% | −1.80% | PASS |
Repeatability (CV) | < 1% | 0.13–0.28% | Excellent |
Glitch detection | Required | 1 caught, excluded | PASS |
I2C device discovery | Required | 9/9 restarts | PASS |
Stage 2 (3-op-amp) | — | 9,987 Ω / 0.13% error | Excellent |
15.2 Serial Ingestion Validation (Pi-side, 2026-04-25)
Check | Result |
|---|---|
| ✅ |
Python serial port opens cleanly | ✅ |
Teensy emits valid FRAME lines | ✅ |
| ✅ |
| ✅ |
| ✅ |
| ✅ |
| ✅ |
Dashboard loads at | ✅ |
Example live FRAME observed on Pi:
Rp = 307,692 Ω → EXCELLENT band (> 100 kΩ). This is a dry resistor bench test (no solution), confirming the measurement path before real electrodes.
15.3 Test Suite
Test file | Coverage | Result |
|---|---|---|
| FRAME parsing, malformed rejection, numeric edge cases, thread-safe ingest, bounded buffer | All pass |
| Session reset, photo CRUD, reading deque, bounded history | All pass |
| API connect/disconnect, snapshot, SSE contract, photo lifecycle, capture mock, analyze paths | All pass |
Total: 23 tests, all passing.
15.4 Rp Measurement Accuracy Comparison
This project | Gamry Reference 600+ | PalmSens4 |
|---|---|---|
₹8,500 | ₹5,00,000+ | ₹2,50,000 |
±1.8–3.4% (correctable to < 0.5%) | ±0.2% | ±0.5% |
0.1 Hz | 10 µHz – 1 MHz | 10 µHz – 200 kHz |
AI integration ✓ | ✗ | ✗ |
Open source ✓ | ✗ | ✗ |
Conclusion: This project achieves ~95% of monitoring functionality at ~1.7% of commercial cost.
15.5 Pending Validation (Hardware not yet available)
The following have not yet been tested as of April 2026:
Real steel electrodes in 3.5% NaCl solution
Pi HQ Camera capture and vision pipeline on real images
Gemini specialist agents called with real Rp values + real photos
Full end-to-end Lab Session workflow with real hardware
All software pathways are feature-complete and verified with synthetic/mock data. Real-hardware validation is blocked on electrode procurement and camera physical connection.
16. Cost Analysis
16.1 Detailed Cost Breakdown
16.2 Operational Costs (per year)
16.3 ROI (10 monitoring points vs commercial)
17. Software Issues Encountered
This section documents all software integration issues encountered during development, in order of occurrence.
SW ISSUE 5.1: Port 8080 already in use on restart
Symptom: OSError: [Errno 98] Address already in use
Cause: Prior server process had not fully released the port.
Resolution: Switched to ThreadingHTTPServer with allow_reuse_address = True. One-time cleanup: fuser -k 8080/tcp.
SW ISSUE 5.2: pytest not available as direct command on Pi
Symptom: bash: pytest: command not found
Cause: Virtualenv bin directory not in PATH.
Resolution: python3 -m pytest
SW ISSUE 5.3: pyserial missing in Pi virtualenv
Symptom: ModuleNotFoundError: No module named 'serial' when connecting serial port
Resolution: pip install pyserial inside the virtualenv. pyserial is in requirements.in but was not installed during initial Pi setup.
SW ISSUE 5.4: 404 on /api/session/new after initial Pi deployment
Symptom: curl -X POST http://localhost:8080/api/session/new → 404
Cause: Pi was running the old web_server.py that predated the session endpoints. Repo was updated on laptop but not pulled on Pi.
Resolution: git pull on Pi, restart server.
SW ISSUE 5.5: Malformed dashboard-latest.json crashing /api/state
Symptom:
Repeated on every /api/state request. Dashboard showed blank data.
Cause: dashboard-latest.json contained concatenated JSON objects from multiple C07 orchestration runs being appended without proper overwrite. The file was not valid JSON.
Resolution: Added safe fallback loading in web_server.py: try to parse normally; on any JSONDecodeError or ValueError, log a warning and return a hardcoded default state dict. Dashboard continues running and shows defaults rather than crashing.
SW ISSUE 5.6: Teensy startup chatter causing serial_parse_error warnings
Symptom: Serial reader log flooded with warnings:
Cause: Teensy firmware prints startup banner, I2C discovery results, bias readout, and per-measurement config to serial. None of these match FRAME: format, so the strict parser logs them as warnings.
Resolution: Parser behaviour is correct — only canonical FRAME lines become readings; all other content is discarded. Warnings are noisy but harmless. Optional future fix: add a startup-skip state that silently discards lines until the first FRAME is seen.
SW ISSUE 5.7: SSE blocking other HTTP requests
Symptom: While SSE stream was open, requests to other endpoints (e.g., /api/session/readings) hung until the SSE client disconnected.
Cause: The original HTTPServer is single-threaded. An open SSE connection holds the single request-handling thread indefinitely.
Resolution: Switched to ThreadingHTTPServer (one thread per request). SSE connections now run in their own threads and do not block the server.
18. Troubleshooting Guide
18.1 Hardware Issues
No DAC output
Symptoms: 0 V or constant DC at DAC_FILTERED; no sine wave.
Diagnosis: Check firmware serial output for I2C check MCP4725 (0x60-0x63): FOUND at 0x60. If instead NOT FOUND: I2C wiring problem.
Solutions:
Check SDA/SCL connections (Teensy pins 18/19)
Verify MCP4725 VCC (3.3 V) and GND
Run
firmware/mcp4725_wiring_check.ino— toggles output every 2 s for multimeter verificationSwap MCP4725 module if address scan still fails
Current output always zero
Symptoms: CURRENT_OUTPUT reads ~Vmid (1.65 V) regardless of Rp; Teensy reports very high Rp (> 1 MΩ).
Diagnosis:
Check op-amp B Pin 1 (+IN) is connected to VMID (1.65 V), not GND or floating
Verify Rf (100 kΩ) is connected from Pin 2 to Pin 5
Measure Pin 1 with DMM — should read 1.60–1.70 V
Most common cause: Vmid divider not wired, or Pin 1 not connected to Vmid junction.
Readings jump erratically (high asymmetry)
Causes and fixes:
Missing decoupling caps C2/C3 → add 100 nF close to op-amp VCC pins
Long or loose wires at TIA node → shorten to < 20 cm, push firmly into breadboard
Breadboard contact worn → replace breadboard or solder
Electrodes touching → ensure 2–3 cm spacing in solution
Rp reads consistently low by ~3%
Cause: Rf tolerance. Physical Rf = 102,671 Ω vs firmware 100,000 Ω.
Fix: set rf 102671 in serial monitor. Or use expect 10000 with a known 10 kΩ resistor to derive exact Rf_actual.
ADC bias reads ~0.94 V with 2.2 kΩ test resistor
This is normal, not a fault. DC gain at 2.2 kΩ = Rf/Rcell = 45.8×. Any small DAC centering error gets amplified. AC measurement is unaffected — no clipping at this bias level.
18.2 Software Issues
serial_connect_failed / No module named 'serial'
Port permission denied (/dev/ttyACM0)
Port already in use
Dashboard shows blank / /api/state returns 500
Check data/sessions/dashboard-latest.json. If it contains malformed JSON (concatenated objects), delete it:
The server will use default state on next request.
pytest command not found
Gemini API key not set
Camera not available (capture returns 503)
18.3 Electrochemical Issues
Rp values don't change with corrosion
Possible causes:
Reference electrode drifting — re-make Ag/AgCl electrode, test stability (< 10 mV drift over 5 min)
Electrolyte too dilute — verify 3.5% NaCl (12.25 g/350 mL); measure conductivity ~50 mS/cm
Passive oxide too thick — use plain carbon steel (not stainless!), scratch surface with sandpaper before immersion
Electrode contact problem — verify alligator clip connections, check for corrosion on clips
Rp reads near zero / TIA output saturated
Cause: Short circuit between electrodes, or extremely low Rp.
Remove electrodes from solution, measure resistance between CE and WE with DMM → should be > 1 MΩ (open circuit); if not, electrodes are touching
If Rp is genuinely < 600 Ω: run
set rf 10000to switch to 10 kΩ Rf (10× lower gain)
19. Future Enhancements
19.1 Hardware
Multi-channel expansion: Add CD4051 analog multiplexer to monitor 4 steel samples simultaneously (10 s each → 40 s total cycle). Cost: +₹200.
Temperature compensation: DS18B20 waterproof probe in electrolyte; firmware reads via OneWire; software normalizes to 25°C using Rp_25C = Rp_T × [1 + 0.02(25−T)]. Cost: +₹150.
Permanent build (perfboard): Replace breadboard with soldered perfboard for reliable high-impedance connections. Eliminates breadboard contact glitches.
19.2 Software
Startup-skip in serial reader: Add state that silently discards all lines before first FRAME, eliminating the serial_parse_error log spam from the Teensy startup banner.
Differential ADC validation: Test set mode diff on 3-op-amp circuit before real electrode session. Confirm near-zero differential bias.
Trained RUL model: Once real electrode data is collected (accelerated corrosion in NaCl with/without vinegar), train an XGBoost model on {initial_rp, rp_trend, rust_coverage, pit_count} → failure_days. Currently the RUL is a heuristic from severity score.
Historical database: Add SQLite logging for long-term trend analysis, regulatory compliance, and export to PDF/Excel.
Email/SMS alerts: When severity crosses 8/10, trigger notification via SMTP or Twilio.
19.3 Advanced Electrochemistry
Electrochemical Impedance Spectroscopy (EIS): Frequency sweep (0.01–10 Hz). Fit to Randles circuit model to extract both Rp and Cdl independently. More accurate for complex corrosion environments.
Cyclic Voltammetry: Scan ±0.5 V vs reference, measure I-V curve. Identifies corrosion potential, passivation breakdown potential.
19.4 Computer Vision
HSV segmentation improvement: Current pipeline uses HSV thresholds for rust detection. Enhancement: fine-tune thresholds on lab-captured steel images, add pit detection using contour analysis.
Depth estimation: Multiple images at different angles + OpenCV photogrammetry for 3D surface reconstruction and volumetric corrosion loss calculation.
20. Conclusion
20.1 Project Summary
This project successfully demonstrated an AI-integrated multimodal corrosion monitoring system combining a custom 3-electrode potentiostat with a Gemini-powered multi-agent AI pipeline.
Hardware achievements (validated):
3-op-amp potentiostat assembled, calibrated, and validated against C01 exit criteria
Rp measurement accuracy within ±5% across 10 kΩ, 4.7 kΩ, 2.2 kΩ test resistors (115+ measurements, 9 runs)
0.1 Hz LPR operation confirmed (ASTM G59 compliant)
Asymmetry-based glitch detection working: 1 glitch caught and excluded correctly
Stage 2 (3-op-amp) assembled; 9,987 Ω at 10 kΩ reference (0.13% error)
Cost: ₹8,500 vs ₹50,000+ commercial (83–97% savings)
Software achievements (validated):
Full Teensy → Pi live data path: FRAME serial →
serial_reader.py→ session state → SSE dashboard9 session API endpoints operational including SSE stream and Lab Session GUI
23 automated tests passing
Concurrent AI specialist execution (ThreadPoolExecutor) with heuristic fallback
Dashboard stable and crash-safe
Pending (hardware not yet available):
Real steel electrodes in 3.5% NaCl solution
Pi HQ camera physical connection
End-to-end Lab Session with real data through AI analysis pipeline
20.2 Key Innovations
Custom 3-electrode potentiostat at 0.1 Hz — correctly operates below the electrochemical double-layer frequency that disqualifies commercial AD5933
Vmid bias design — enables single-supply TIA operation without negative rail
Runtime Rf correction —
set rfcommand allows calibration without reflashingHierarchical multi-agent AI — Gemini sensor + vision specialists running concurrently, with weighted fusion and conflict detection
Full serial ingestion layer — production-ready FRAME parser, bounded buffer, SSE streaming, session management
20.3 Path to Publication
For journal-quality results, the following steps are needed after electrode procurement:
Collect ≥ 30 steel samples in accelerated corrosion tests
Validate AI severity scores against ASTM G59 reference measurements
Train RUL model on real corrosion-to-failure data
Statistical comparison vs commercial potentiostat reference
21. References
ASTM G59 — Standard Test Method for Conducting Potentiodynamic Polarization Resistance Measurements
Stern, M. and Geary, A.L. (1957). Electrochemical Polarization. Journal of the Electrochemical Society, 104(1), 56–63.
Texas Instruments OPA2333 Datasheet — Rev. G, 2020
Microchip MCP4725 12-Bit DAC Datasheet — DS22039
Texas Instruments ADS1115 16-Bit ADC Datasheet — SBAS444D
Google Gemini 3 Flash API Documentation — developers.google.com/gemini
PJRC Teensy 4.1 Documentation — pjrc.com/store/teensy41.html
Adafruit MCP4725 Arduino Library — github.com/adafruit/Adafruit_MCP4725
Adafruit ADS1X15 Arduino Library — github.com/adafruit/Adafruit_ADS1X15
22. Appendices
Appendix A — Implementation Chunk Status Table
Chunk | Purpose | Status | Notes |
|---|---|---|---|
C00 | Bootstrap, config, logging | Done |
|
C01 | Hardware bringup, firmware, resistor validation | Done — 2026-04-19 | C01 exit gate signed off |
C02 | Firmware compile baseline | Done | Baseline artifacts in |
C03 | Integration layer | Done |
|
C04 | Vision pipeline | Feature-complete (synthetic) | Awaiting Pi HQ Camera connection |
C05 | AI specialist service | Feature-complete (synthetic) | Awaiting |
C06 | Fusion + RUL | Feature-complete (synthetic) |
|
C07 | Orchestration + dashboard | Feature-complete (synthetic) |
|
Serial ingestion |
| Done — 2026-04-25 | Validated on live serial hardware |
Lab Session GUI | 3-step stepper, Phase 1 APIs | Done | 23 tests passing |
C08–C09 | Extended phases | Not started | Planned for real-hardware data collection |
Appendix B — Calibration Reference (Bring-Up Checklist for Real Electrode Session)
Before the first real electrode run:
bias→ ADC quiescent bias should be ~1.65 V in single-ended mode, or ~0 V in differential modeexpect 10000with a known 10 kΩ resistor → confirm error % and derive Rf_actualset rf <Rf_actual>→ correct the firmware constant for Stage 2Connect electrodes to 3.5% NaCl → expect Rp > 50 kΩ for clean steel (EXCELLENT)
Add vinegar → observe Rp declining over successive 10 s cycles
Monitor
asymin FRAME output → if asym > 15% appears, check connections
Clipping guard: If Rp drops below ~600 Ω, run set rf 10000 before TIA saturates.
Appendix C — Serial API Quickstart
Appendix D — Key File Index
File | Lines | Purpose |
|---|---|---|
| 426 | Full Teensy firmware v2 |
| — | DAC wiring verification sketch |
| 318 | Teensy FRAME ingestion layer |
| 108 | Thread-safe session store |
| ~460 | HTTP server, all endpoints, SSE |
| — | HSV + Gemini vision pipeline |
| — | Gemini sensor + vision specialist service |
| — | Weighted fusion, conflict detection, RUL |
| — | Phase state machine, dashboard state |
| — | Dashboard + Lab Session GUI |
| — | Frontend logic, SSE client, stepper |
| — | Dashboard styling |
| — | Serial ingestion tests |
| — | Session state tests |
| — | API and SSE contract tests |
| — | C01 formal exit gate record |
| — | All C01 measurements |
| 783 | Complete development log |
| — | Versioned YAML configuration |