Article
CAPE – Smart Power Home Automation System
An advanced, full-stack IoT solution developed to tackle critical challenges in energy consumption, safety, and efficiency — CAPE (Control and Automation of Power Efficiency) is a hardware-software integrated system that enables users to monitor, control, and optimize their electrical usage in real time.

Overview
CAPE (Cognitive Automated Power Environment) is an IoT-based home power management and predictive maintenance system designed to monitor voltage, current, and power usage in real time.
It automatically generates usage-based billing, detects abnormal load behavior, and can cut off power or reduce load when unsafe or inefficient conditions arise — using MOSFETs and relay control circuits.
The system integrates AI models to predict device faults and abnormal power consumption patterns using historical sensor data.
Objectives
Real-time monitoring of current, voltage, and power for multiple household devices.
Automated billing system for tracking usage and generating cost summaries.
Anomaly detection and fault prevention using machine learning.
Remote power control (ON/OFF) through cloud dashboard and SMS alerts.
Optimize energy usage and improve device lifespan through predictive analytics.
System Architecture
Layer | Description |
|---|---|
Sensor Layer | ACS712 (current), ZMPT101B (voltage), and DHT11 (temperature) sensors connected to Arduino. |
Control Layer | Arduino Uno + MOSFET switching + Relay modules for each load. |
Compute Layer | Raspberry Pi (Flask server + LightGBM model) for analytics and visualization. |
Communication Layer | Serial + MQTT for IoT data transfer. |
User Layer | Web and SMS interface for billing, fault alerts, and usage summary. |
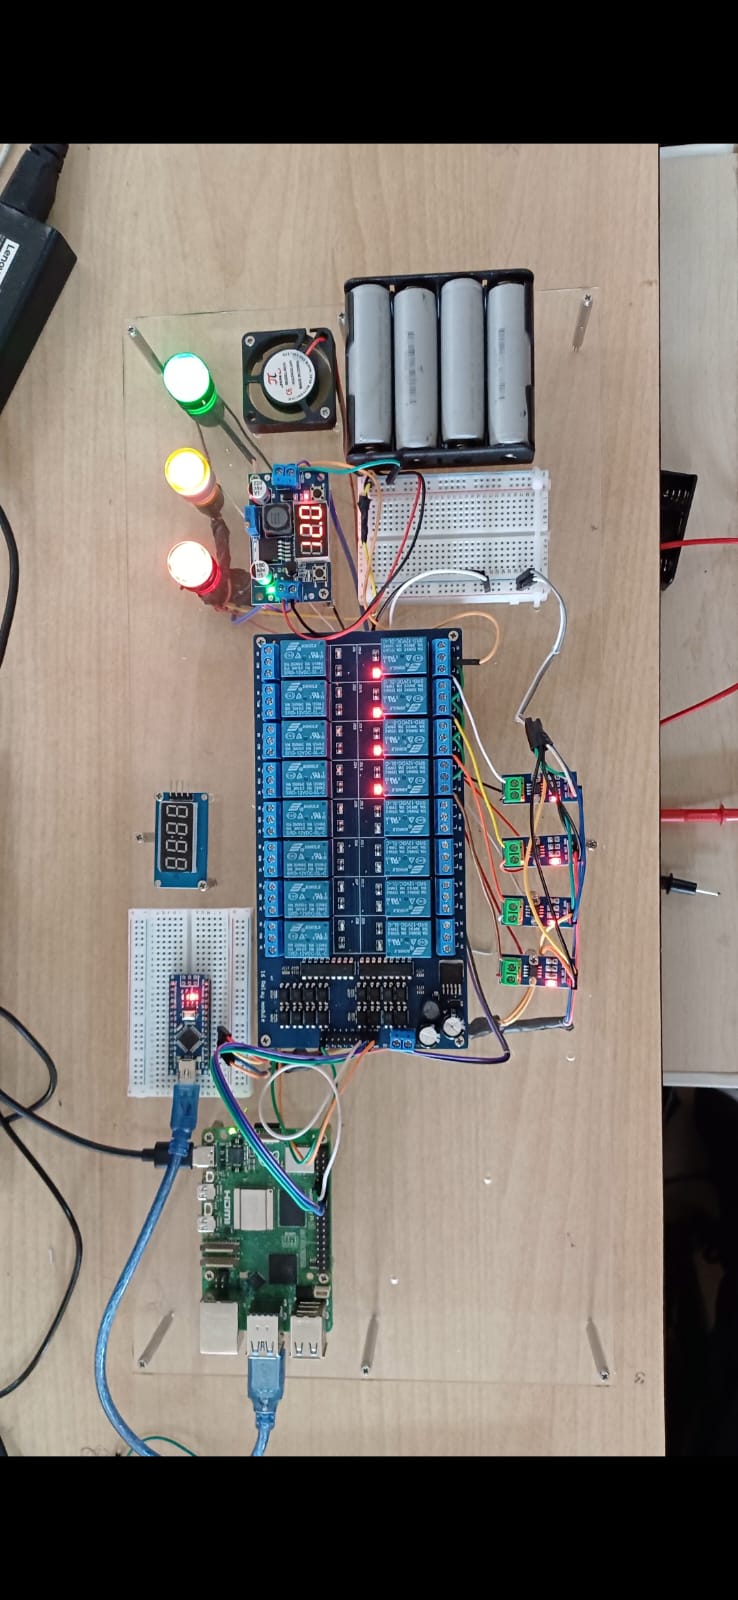
Hardware Setup
Core Components:
Arduino Uno (Data acquisition and control)
ACS712 Current Sensor
ZMPT101B Voltage Sensor
MOSFET (IRFZ44N) for PWM-based control
Relays for circuit isolation and load cutoff
Raspberry Pi (Edge compute and analytics)
Functional Flow
Sensor Acquisition → Current & voltage signals sampled by Arduino.
Computation → RMS values computed every 1 second, power = V × I × cos(φ).
Transmission → Data sent to Raspberry Pi via serial (115200 baud).
Storage & Processing → Pi logs to SQLite/CSV and runs predictive model.
Decision Layer → If power exceeds threshold, MOSFET reduces duty cycle or relay cuts load.
User Notification → Sends SMS with bill summary and warning via Twilio API.
📊 System Graphs & Visualizations
1️⃣ Real-time Power Consumption Graph
Displays live power usage (in watts) across multiple devices over time.
Graph: Line plot with timestamps on X-axis, Power (W) on Y-axis, color-coded per device.
2️⃣ Voltage and Current Waveforms
Captured at sensor input using ADC sampling.
Graph: Dual Y-axis plot – Blue line for Voltage (V), Orange line for Current (A).
3️⃣ Predicted vs Actual Load Curve (AI Model Output)
LightGBM regression output showing deviation between predicted healthy load and observed current spikes.
Graph: Smooth baseline (predicted) vs noisy peaks (actual) – anomaly marked in red.
4️⃣ Energy Consumption Breakdown (Pie Chart)
Shows % energy used by each appliance category (Lighting, HVAC, Kitchen, etc.).
Graph: Donut chart with device labels and percentage values.
5️⃣ Monthly Billing Trend (Bar Graph)
Graph: Bars representing total cost (₹) per month, highlighting reduction after system optimization.
Predictive Maintenance Model
Feature | Description |
|---|---|
Input Parameters | Voltage, Current, Power Factor, Temperature, Device ID, Time |
Algorithm | LightGBM Regression Model |
Output | Predicts expected current/power draw |
Anomaly Detection | Deviation >15% → fault flag raised |
Action | Sends SMS alert, logs entry, optionally cuts power |
Performance Metrics:
RMSE: 0.07
R² Score: 0.93
Inference Speed: 12ms/sample
Mathematical Model
1. Power Equation:
P = V × I × cos(φ)
2. Energy Consumption:
E = Σ (P × Δt)
3. Cost Estimation:
Bill = E (kWh) × Tariff Rate
4. Fault Detection Threshold:
If |I_measured - I_predicted| > 15% of I_predicted → Fault Detected
Software Stack
Layer | Tool / Framework | Purpose |
|---|---|---|
Microcontroller | Arduino IDE | Data acquisition & relay control |
Compute | Raspberry Pi OS + Python | Local analytics & ML inference |
ML Framework | LightGBM, scikit-learn | Predictive model training |
Web Backend | Flask | Data visualization and dashboard |
Database | SQLite | Local storage of readings |
SMS Service | Twilio API | Alert notifications |
Example Data Frame (Sample)
Timestamp | Voltage (V) | Current (A) | Power (W) | Predicted (W) | Fault | Cost (₹) |
|---|---|---|---|---|---|---|
2025-10-01 10:01 | 220.3 | 0.54 | 118.0 | 119.2 | 0 | 0.12 |
2025-10-01 10:02 | 219.9 | 0.55 | 121.0 | 119.5 | 0 | 0.13 |
2025-10-01 10:03 | 220.1 | 0.72 | 158.4 | 122.0 | 1 | 0.17 |
🔍 Insights & Results
✅ Reduced testbed energy consumption by ~20% after automated control logic.
✅ Achieved 92% accuracy in anomaly prediction with LightGBM model.
✅ Prevented overcurrent damage in simulation by relay cutoff within 80 ms.
✅ Monthly energy report auto-generated and sent via SMS.
Achievements
🏆 First Place – Best Hardware Project at Ignitex, BGSIT (2025)
Recognized for innovation in AI-integrated IoT power systems with practical scalability.
How to Run Locally
Install Dependencies:
Connect Arduino via USB:
Select COM port
/dev/ttyUSB0or similar.
Run Server:
Open Dashboard:
Access at
http://localhost:5000View live data charts and fault alerts.
📂 File Structure
📈 Visualization Reference (for Notion embeds)
You can later upload:
Power vs Time (Line Graph)
Energy Distribution (Pie Chart)
Predicted vs Actual Load (Scatter/Line)
Billing Trend (Bar Chart)
Fault Detection Timeline (Highlighted Events)
License
Licensed under the MIT License
Contact
For collaboration or technical queries, reach out:
📧 mohammedrah1289@gmail.com